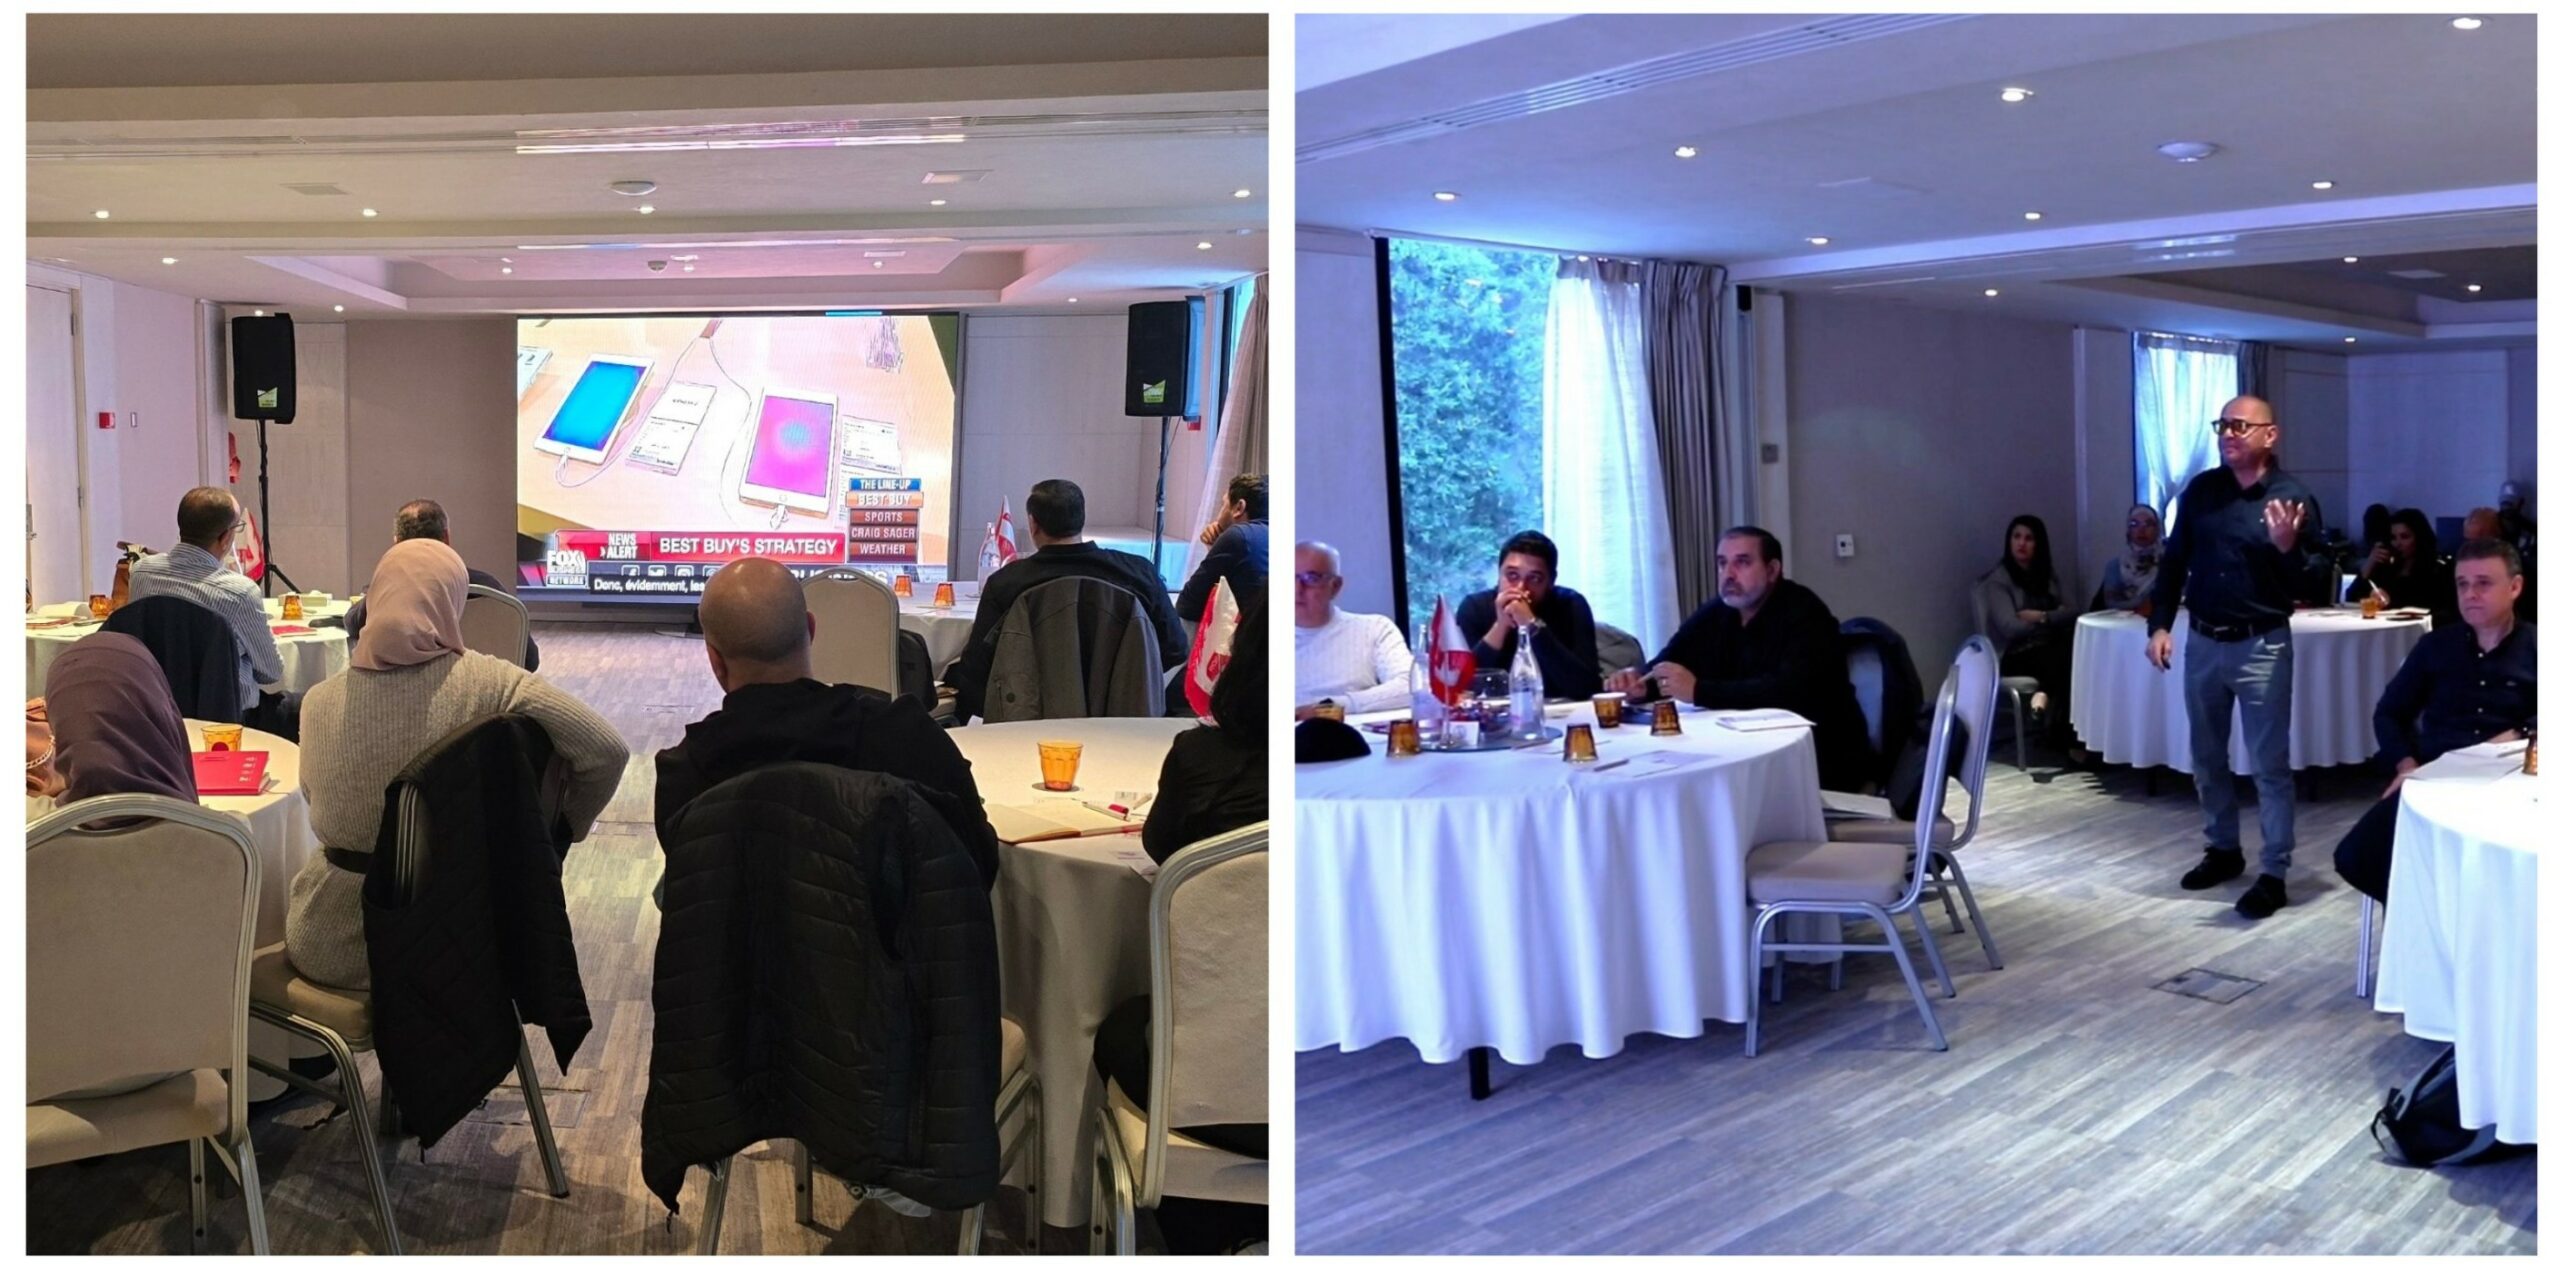
OPEX Tools workshops provide hands-on training in specific tools and technologies that support operational excellence initiatives. These workshops develop practical skills in data analysis, project management, and specialized improvement methodologies.
Value Proposition
Target Audience: Process improvement specialists, project managers, analysts, and professionals who need to apply specific tools in operational excellence initiatives.
MS Project FastTrack
Workshop Description: This workshop provides a fast-track approach to mastering Microsoft Project for effective project planning and management. Participants will learn essential features and best practices to develop, track, and report on projects efficiently.
Learning Outcomes:
Who Should Attend:
Workshop Outline:
- Schedule Development
- Task creation and organization
- Duration estimation techniques
- Dependency types and setup
- Constraints and deadlines
- Resource Management
- Resource types and creation
- Cost tracking and management
- Project Tracking
- Baseline setting and management
- Progress updating methods
- Reporting and Communication
- Visual dashboards
- Export and sharing options
- Standard reports configuration
- Custom report development
- Visual dashboards
- Change management in MS Project
- Variance analysis
- Progress updating methods
Minitab
Workshop Description: This workshop provides hands-on training in Minitab statistical software for data analysis and process improvement. Participants will learn how to use Minitab to analyze data, create visualizations, and apply statistical tools for operational excellence initiatives.
Learning Outcomes:
Who Should Attend:
Workshop Outline:
- Graphical Analysis
- Basic graphs creation and customization
- Multi-variable and grouped visualizations
- Time series and trend analysis
- Advanced visualization techniques
- Statistical Analysis
- Descriptive statistics
- Hypothesis testing
- Correlation and regression analysis
- ANOVA and other comparative tests
- Process Analysis
- Control chart creation and interpretation
- Process capability analysis
- Measurement systems analysis
- Non-normal data handling
- Design of Experiments
Business Analytics | Power BI
Workshop Description: This workshop provides hands-on training in Microsoft Power BI for business analytics and operational excellence. Participants will learn how to connect to data sources, transform data, create interactive visualizations, and build dashboards that drive operational improvements.
Learning Outcomes:
Who Should Attend:
Workshop Outline:
- Data Connection and Preparation
- Data source connections
- Query Editor techniques
- Data transformation methods
- Data modeling best practices
- Data Modeling and DAX
- Relationship creation and management
- Calculated columns and measures
- Basic DAX functions
- Time intelligence calculations
- Visualization Development
- Visual selection principles
- Chart and graph customization
- Table and matrix formatting
- Custom visuals integration
- Dashboard Design and Sharing
- Dashboard layout principles
- Interactive features and filtering
- Publishing and sharing options
- Collaboration and security settings
Root Cause Analysis
This workshop provides a comprehensive approach to root cause analysis for problem-solving in operational contexts. Participants will learn structured methodologies to identify true root causes rather than symptoms, and develop effective countermeasures that prevent recurrence.
Learning Outcomes:
Who Should Attend:
Workshop Outline:
- Core RCA Methodologies
- 5 Why analysis
- Fishbone (Ishikawa) diagrams
- Fault tree analysis
- Pareto analysis for prioritization
- Advanced RCA Techniques
- Barrier analysis
- Change analysis
- Current reality trees
- System analysis approaches
- Countermeasure Development
- Solution generation techniques
- Evaluation and selection criteria
- Implementation planning
- Effectiveness verification
- Organizational Learning Systems
- Knowledge capture and sharing
- Trend analysis across problems
- Preventive analysis approaches
- Building a learning culture
Excel Data Analysis
This workshop focuses on using Microsoft Excel for data analysis in operational excellence contexts. Participants will learn advanced Excel techniques for data preparation, analysis, visualization, and reporting that support data-driven decision making.
Learning Outcomes:
Who Should Attend:
Workshop Outline:
- Advanced Functions and Formulas
- Lookup and reference functions
- Text and data manipulation
- Date and time analysis
- Logical and conditional functions
- Data Analysis Tools
- PivotTables and PivotCharts
- Data tables and scenario manager
- Statistical analysis tools
- Solver and optimization
- Visualization and Dashboards
- Chart selection and customization
- Conditional formatting techniques
- Interactive elements creation
- Dashboard layout and design
- Automation and Efficiency
- Named ranges and dynamic references
- Data validation techniques
- Template development
Statistics Foundations
This workshop provides essential statistical concepts and techniques for data-driven operational excellence. Participants will learn how to apply statistical thinking to business problems, analyze data appropriately, and make sound decisions based on statistical evidence.
Learning Outcomes:
Who Should Attend:
Workshop Outline:
- Descriptive Statistics
- Measures of central tendency
- Measures of dispersion
- Distribution shapes and properties
- Graphical representation techniques
- Inferential Statistics
- Sampling concepts
- Confidence intervals
- Hypothesis testing fundamentals
- Statistical vs. practical significance
- Relationship Analysis
- Correlation analysis
- Simple linear regression
- Multiple regression introduction
- Association vs. causation
- Statistical Applications in OPEX
- Process capability analysis
- Statistical process control
- Measurement system analysis
- Design of experiments overview